DigMyData: Aha!-nalytics
I've never been a metrics lover. Stories like Google A/B testing 41 shades of blue make me cringe.
I explain our industry's recent infatuation with analytics-driven-development in part as a reflection of our nerdy shy personalities: it's a way to try to learn what your users do without having to go through the enormous effort to actually talk to another human being! Epic win! 😉
Personally, I would MUCH rather spend my time talking to our customers. The amount of actionable information I always receive from watching someone use their tool for an hour is, IMHO, orders of magnitude higher than what I'd get spending the same hour trying to devine action items out of analytics data.
I do believe metrics have their place though: they are great for optimizing, spotting and removing bottlenecks.
Now that Mockups is three years old, our roadmap for the next year or two is pretty much set - our users have been telling us what we need to do loud and clear.
As we have gone mainstream and grow as a company, my job as the CEO is very much focused on making sure we are able to keep up with demand while maintaining the level of quality and support we like to compete on.
Now that the product is past its teen-age years, it's time to optimize.
In other words, do first, optimize later.
Joel Spolsky once told me that my job as the CEO is to come in the office in the morning and ask my employees: What do you need? I have found a tool that helps me answer that question. It's a metrics tool for people who don't have time to look at metrics.
It's called DigMyData, and I want to tell you about it.
But first, I want to tell you a bit about friendship in the age of the Internet.
Adam and Mark

Back in 2008, when Balsamiq was still a one-man operation, I received a feature request from a certain Adam Wride to integrate Mockups with Atlassian JIRA. My memory is a bit fuzzy, but I remember the request as being very enthusiastic at the prospect, but not pushy.
As this was something I had already considered, I spent a few days coming up with an integration and I published it online.
Adam saw it, tested it, loved it and used it for a few days. Then, a few days later, he very gracefully told me it had missed the mark. You see, Adam practically lived in JIRA, while I had only used it once or twice, and never for a real project. He and his long-time co-worker and friend Mark Smith came up with a number of suggestions of how to integrate it better, which they proposed using Mockups and GetSatisfaction.
In the end, they practically designed the Mockups for JIRA product for the rest of us. 🙂
In the months that followed, Adam and Mark became two of the most prolific members of the growing Mockups community, and still contribute to this day - Adam's the most vocal proponent of the crop image feature for instance.
Needless to say, slowly but surely Adam and Mark have earned my trust and respect, one small interaction at the time.
In early 2009 I decided to start building a web app version of Mockups. Still being the only employee, I turned to Mark and Adam for advice on what technology to use to build it. We had a nice chat, which in the end resulted in Luis joining the team to build myBalsamiq full-time.
During that chat it became apparent to me that Mark and Adam were ready to quit consulting to start a business of their own. They had the hunger, and certainly the technical chops. Their first idea was to build a platform for recurrent billing, like Spreedly or Chargify (both of which were just getting started at the time).
In the spring of 2009 I mentioned to Mark and Adam that I was going to be in South Carolina for a few days to visit my in-laws. Mark said "I live in Georgia, I'll come and hang out!". So Mark drove East, rented a hotel room and a conference room in the hotel, and came to work next to me for a few days. Just like that!
During that time we talked about how their startup could power the billing for myBalsamiq, but in retrospect it was too early in the life of both products to be having those conversations. In the end, they decided to focus on the analytics side of their idea, and we ended up using Spreedly for our recurrent billing, as Mark suggested. Still, Mark and I bonded.

I finally met Adam in person at LessConf 2010, where we sat next to each other and had an awesome time - it felt like I was hanging out with an old friend.
Enter DigMyData
As I mentioned, DigMyData spawned from Mark and Adam's original recurrent-billing idea: they realized they were more interested in building the perfect CEO's dashboard rather than having it be a feature of a billing platform, something that is quickly becoming a commodity.
Just like Adam and Mark have been using Mockups since the very early builds, I have been using DMD since the very beginning, the rough-edges days.
Giving them UX and feature feedback has been my way to repay them. This was my turn to design their product, just like they designed Mockups for JIRA for us. 😉
Over time, as I noticed how much I relied on DigMyData every day, I asked Mark and Adam if they'd let me be involved more formally, if they'd let me become an advisor. Basically this product was SO GOOD that I wanted the world to know that I was involved in it. They graciously accepted.
The reason I told you this long story is to show that even on the Internets, real friendships can happen, and take time.
I get about an email a week from people I've never heard from before asking me to become an advisor to their startup, and I'm always reminded of a Ben & Jerry quote. I'm not sure if it was Ben or Jerry, but they were approached by someone who was really pushy about partnering with them. His answer was "I've been dating my girlfriend for 17 years and we're still not married. I've only just met you..." (if you know the full quote I'd love a link, I can't find it!)
Mentorship is like a long-term relationship, you can't just rush into it. Just like in everything else, what you can do is be so good they can't ignore you, earn people's trust and respect, and see what grows!
About the product
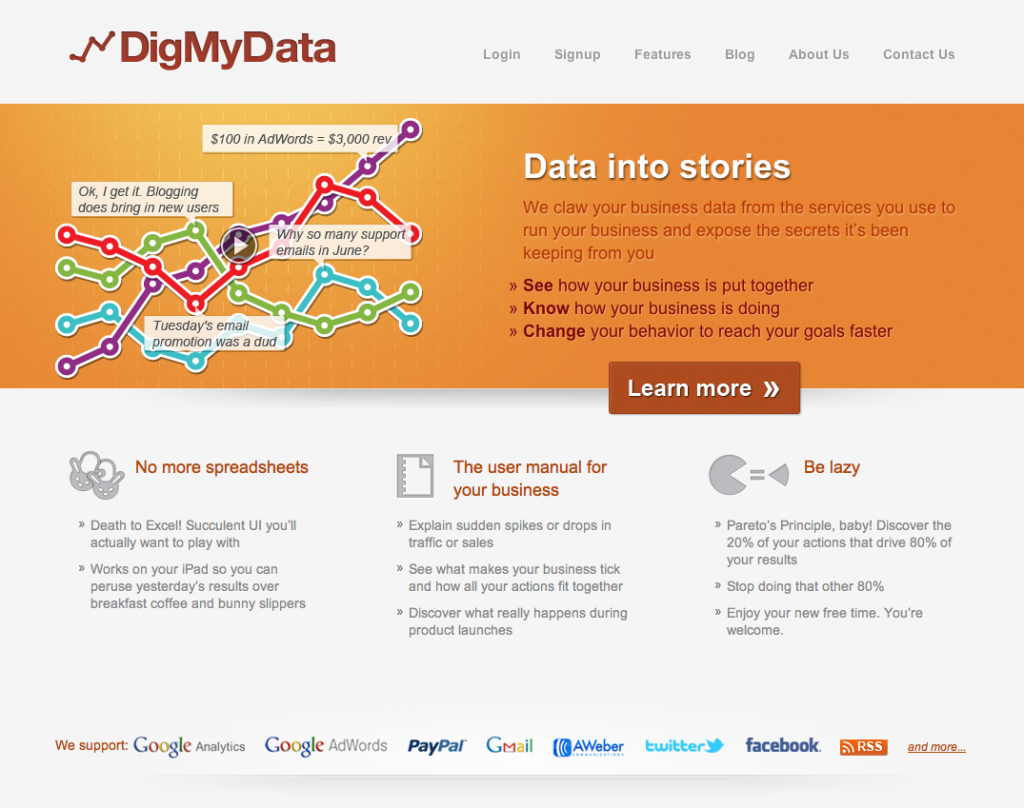
In a nutshell, DigMyData is a BIG, colorful line chart. What makes it special is that the lines on the chart can come from so many different sources. You can plot your Google Analytics data (of course), as well as Paypal and Google Checkout revenue, you can import any RSS feed, plus Twitter followers, Facebook fans, MailChip data, AWeber, you name it. A killer feature, IMHO, is the GMail integration: you can set it up to pull any GMail label and count the emails in that folder. New source types get added all the time, just ask. You can also import an Excel spreadsheet with your own data, of course.
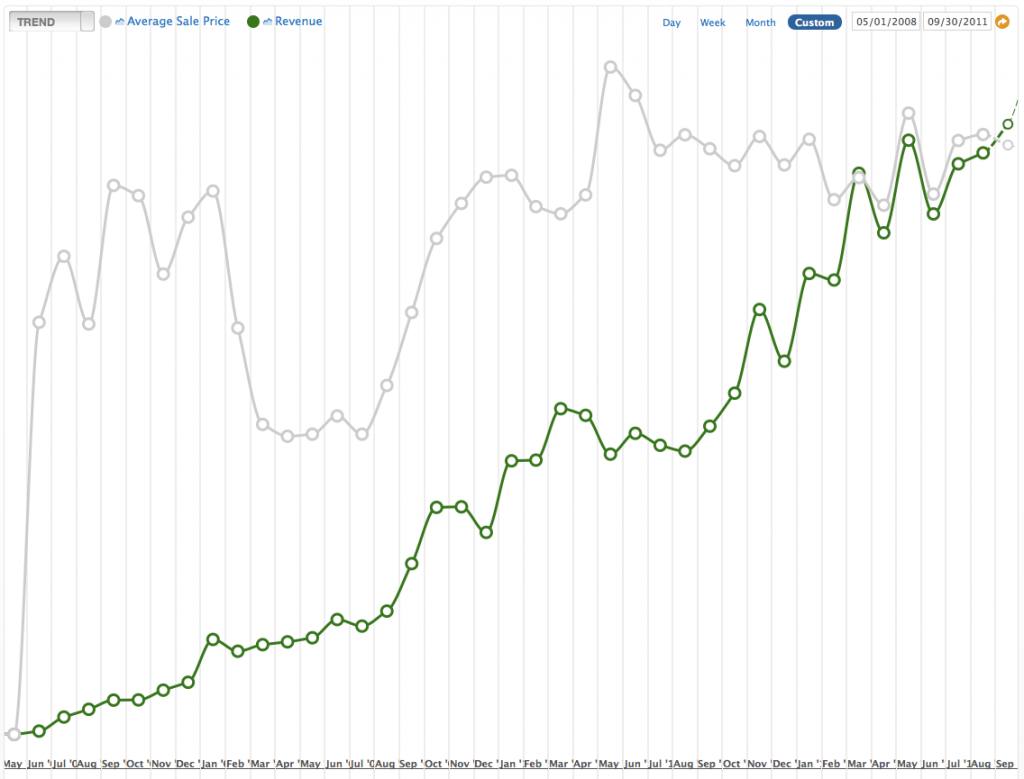
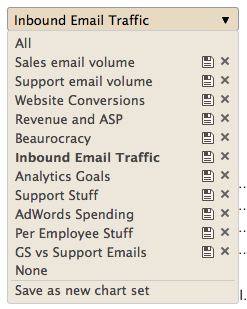
Once you have all your sources set up and gathering data, the fun really begins. You can create different sets of lines to show and save them. For instance I have a "Revenue and ASP" set showing our total revenue line and our average sales price line.
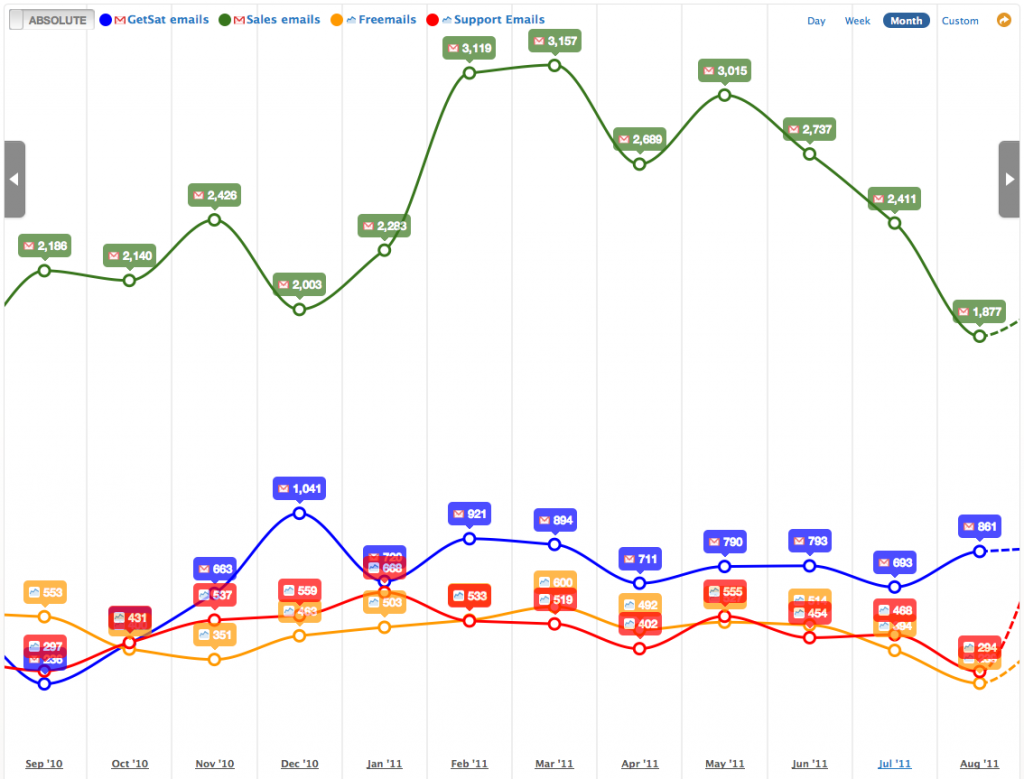
I also have a "Email Load" set which charts the emails we receive at sales@balsamiq.com, support@balsamiq.com and free@balsamiq.com, as well as GetSatisfaction interactions.
You can have all sorts of sets, I create new ones as needed.
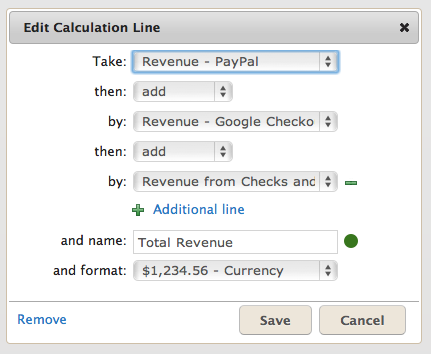
Another very powerful feature is the calculation line feature. With it, you can take two lines and combine them in different ways. For instance, the Total Revenue line is the sum of the Paypal revenue line, the Google Checkout line and the "Checks and Wires" data I import from a spreadsheet.
With these few but very well-designed features (heh), you feel in total control. In fact, most people have a "WHOA" reaction as soon as they see their data show up. It's like stepping back and all of a sudden seeing your business from a higher ground.
You can see how everything is interconnected: a blog post might result in lots of new twitter followers, facebook fans, web mentions, more visitors and ultimately more revenue. Another post might go totally unnoticed.
As I said before, I think metrics are really good for spotting bottlenecks and optimizing. A clear example is what happened with our sales@balsamiq.com emails.
As the number of customer keeps growing, so do the emails we get from them. DigMyData helps me figure out how to cut those down. Clicking on the high point in the chart above shows me a list of all the emails, which I can easily sort and even group by subject line, in a super-simple pivot-table.
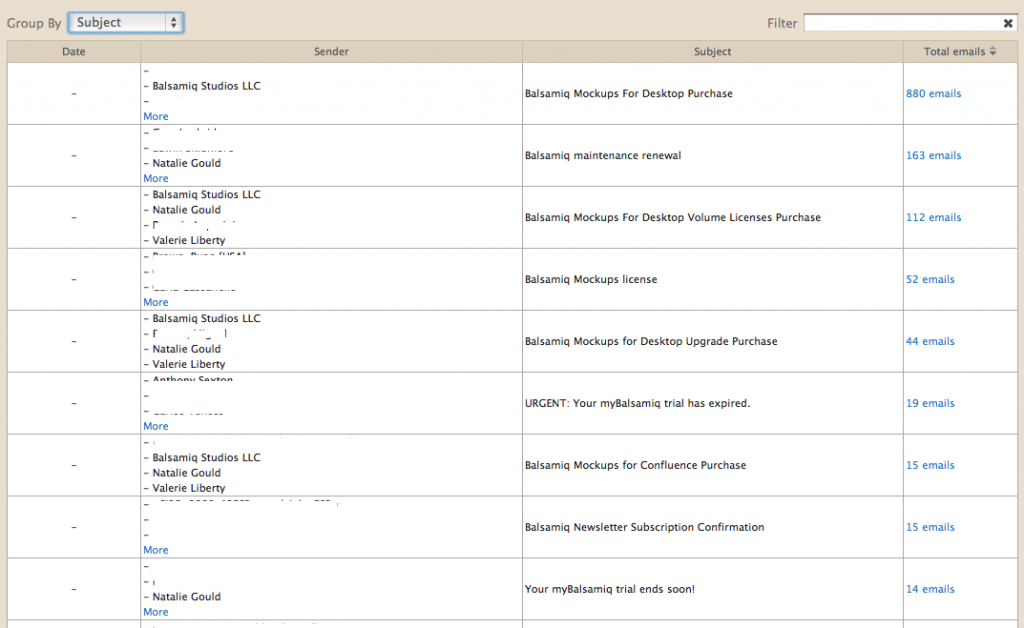
I can spot patterns and dig further, for instance searching for the "lost" keyword
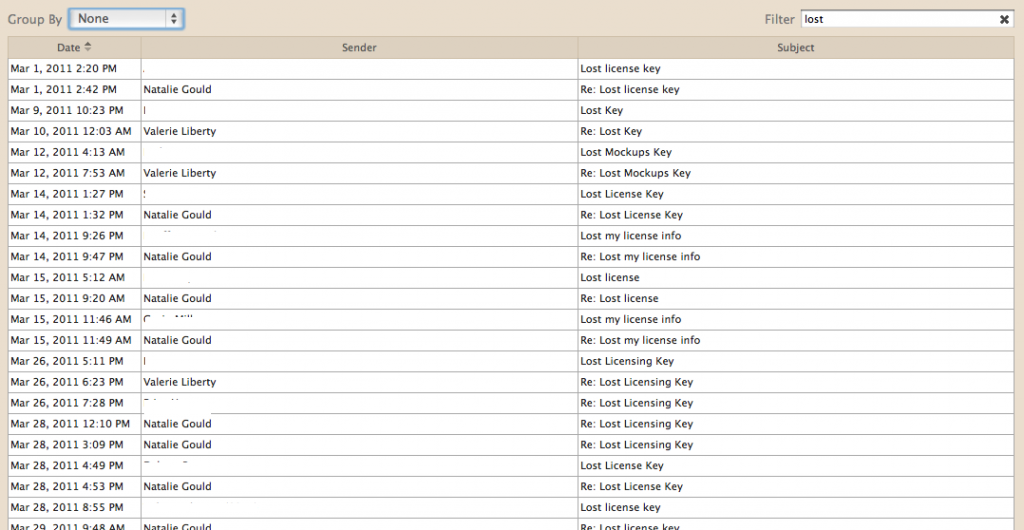
Clearly, lots and lots of people contact us because they can't find their license key - we needed to automate it. So I spent two hours building this, and the next month we saved a couple hundred emails, just like that.
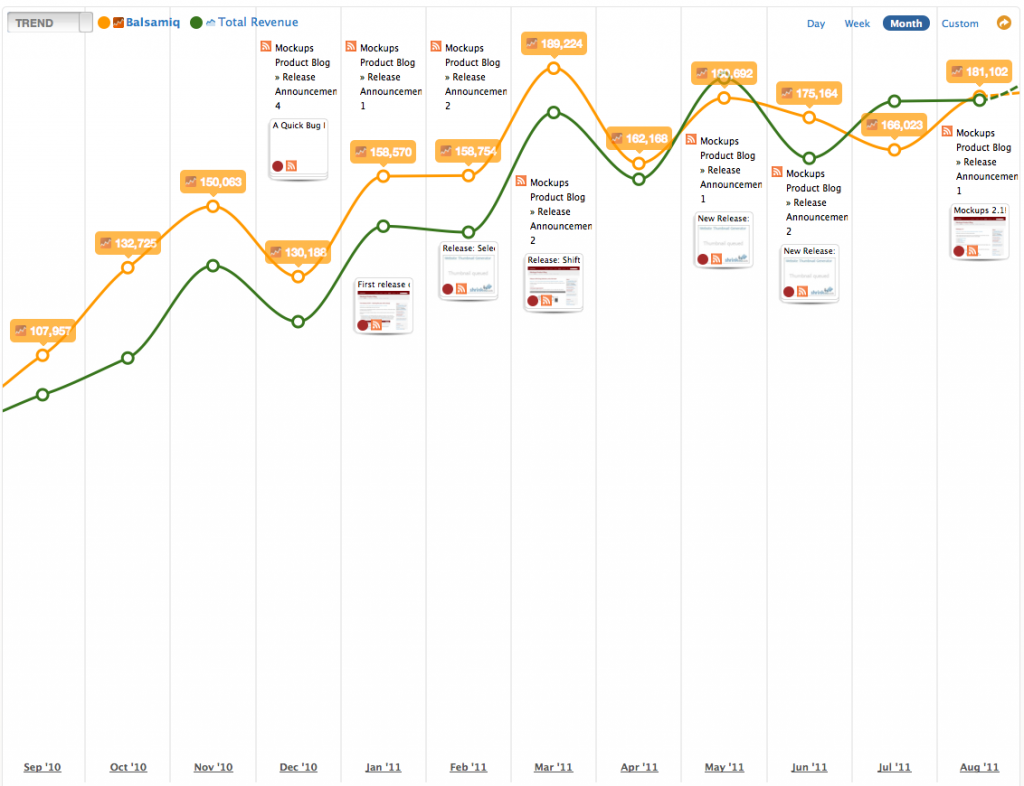
Another example is the chart below that plots how much of our sales come from the website vs those that come via check or wire transfer.
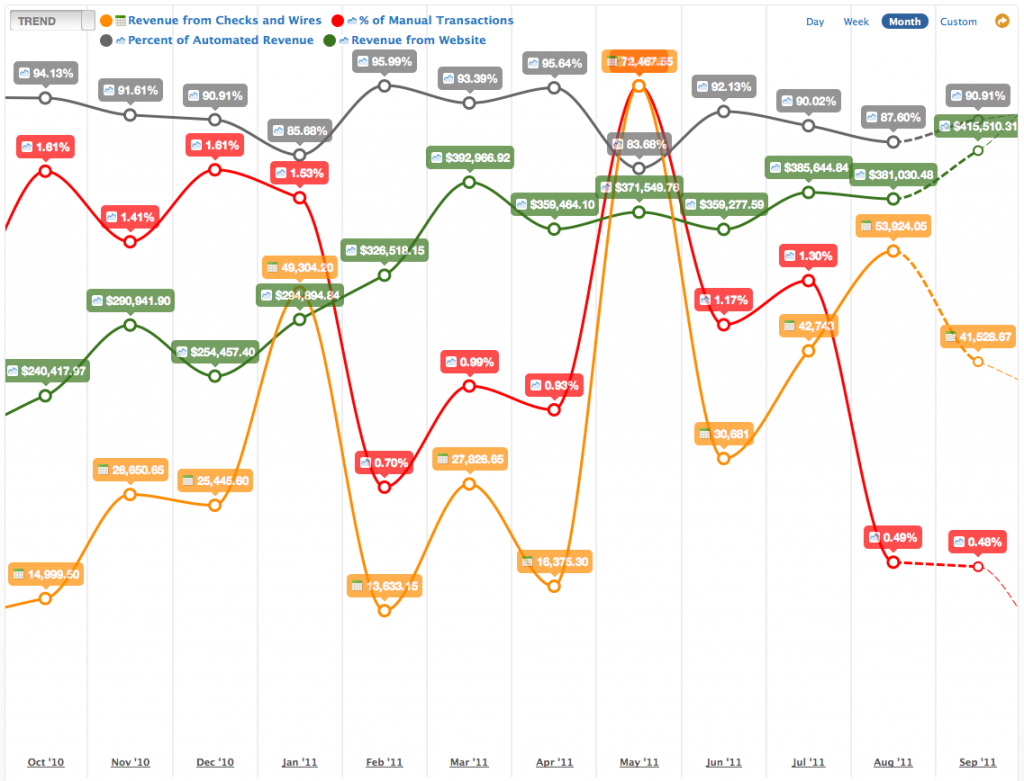
Look at the red line: the way we were able to optimize and lower that "% of Manual Transactions" line in May and then again in July was to enhance our buy page to be able to process upgrade and maintenance purchases automatically.
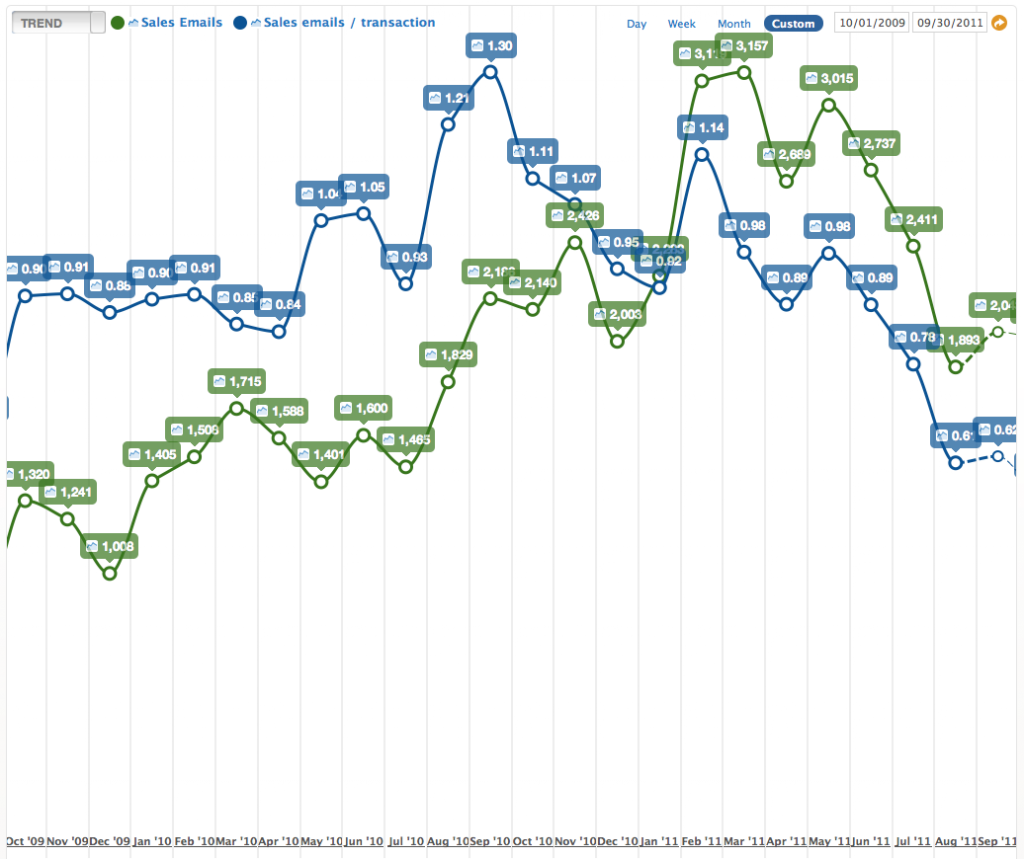
Another thing I really like to do is to divide different lines per my "number of employees" line.
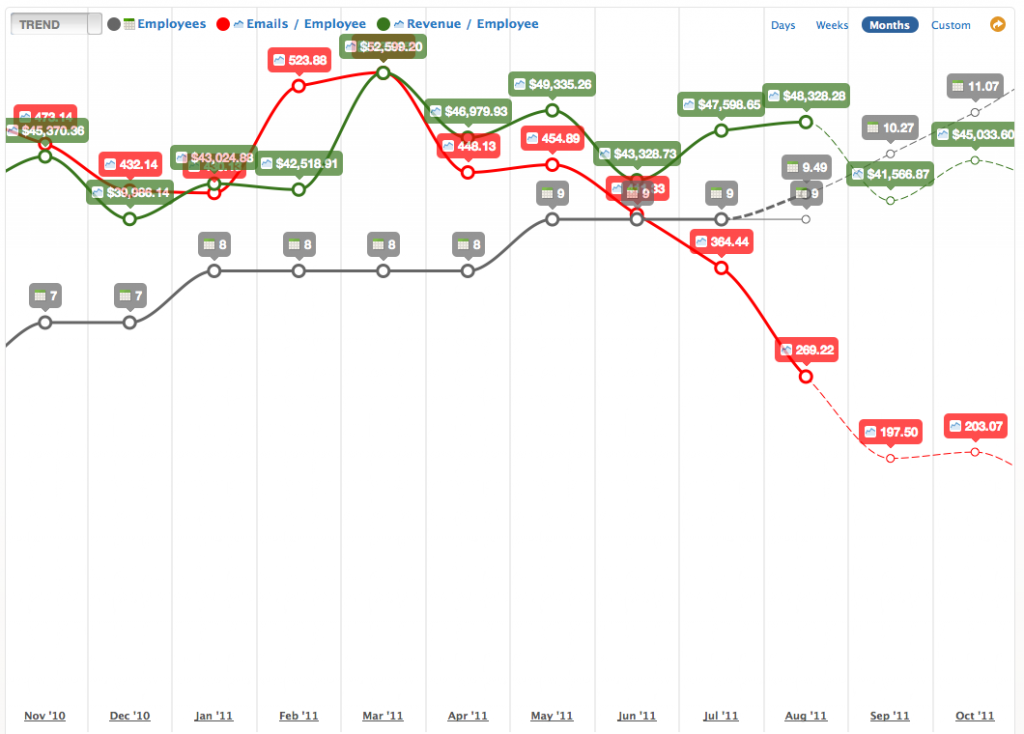
Using the chart above I was able to learn that we are maintaining the $500k/year in revenue per employee level which I want to operate at ($48,328.28 per employee in August means 48x12 = $576k/year). I am also able to see that our recent product and website updates have been working in lowering our per-employee support load, which was at only 269 emails per employee in August. Since we're able to operate nicely when that number is as high as 450-500, this tells me that we're in no rush to hire another tech/sales support person right now. If you look at the September and October forecasts that DMD magically provides, hiring another person would bring the "emails per employee" level to 197, which is way low. We might still want to hire someone soon to go faster, but this chart confirms to me that we're happily handling the load right now.
Cool stuff huh?
I could go on and on, I find out new things about my business almost daily.
Try DigMyData yourself
DigMyData is opening up to the public today.
If you own an internet-powered business, or work for a web agency and want a way to show the effectiveness of your work to your clients, I suggest you sign up and try it out. Pull in every kind of data you can think of, let it sit for a couple of weeks so that it has time to gather enough data, then start digging! 🙂
It's free to try out, and will likely cost $99/month starting in 2012. For me, it's a no brainer.
Hope this helps!
Peldi
Update: a few related links:
- The Official launch post
- A post by Ruben of BidSketch: Better Analytics With DigMyData
- A Hacker News discussion


Comments (9)
It looks like this service is something different in 2019 🙂
What are you using these days?
Hi Noel! Yes they “pivoted” a few years ago. I don’t use anything. We have a home-built chart to track revenue per product, and I meet with our CFO Natalie once a quarter to look at expenses from Quickbook. That’s enough for us. 🙂
Pingback: DigMyData | The Startup Success Podcast
Hi Ruven,
I’m sorry the setup process wasn’t what you expected. Can you email me: adam@digmydata.com so I can understand exactly what happened? We don’t want it happening again!
Adam
Peldi. I am really digging my data today! This is showing me stuff about the visitors to my blog that I have never seen before: Very cool!
However, it may just be my stupidity, but I was NOT digging my data when I first tried it (at your suggestion). I joined up, and added my sources and… nothing. It didn’t say “it will be several hours until you can see your data” or “please come back tomorrow and we’ll have something cool to show you, but it’s not baked yet.” I thought I had done something wrong, and I kept trying to reconfigure my line options etc.
I kinda thought that may be the problem, so I just let it simmer for a couple of days, and when I came back today it was “wow”.
So,I’ve probably missed the instructions that tell me so, but maybe if the chart is blank, just tell your users to come back later, data is still being gathered.
Thanks for pointing me to a great tool!
Ruven
Hi Simo,
This is Adam from DigMyData. Glad you like it.
What data would you like from Webmaster Tools?
Adam
ah… and would be cool to have also Webmaster Tools data! 🙂
Would be nice to have a little snippet of the email content, just to be able to digg a little from the main view, but man… this is the FINAL Web APP!! thanks everybody!!
Pingback: World, Meet DigMyData | DigMyData